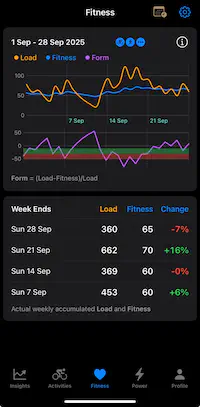
When you first start using RiderPulse, you will see a Load, Fitness and Form graphs like the one shown here when you select the Fitness screen. This graph and the table of numbers below it are fundamental to understanding the training load you are subjecting yourself to and the fitness you are gaining (or losing) as a result.
The Load line (orange) is calculated using an exponential weighted average over the last 7 days and shows your accumulated training load (intensity x volume). Long or intense rides will cause the line to “bump up” while days with little or no activity will cause it to decrease. The Fitness line (blue) shows the change in your fitness level using an exponential weighted average of load over 42 days and is why this responds (more) slowly to changes in your training load. Both show the correlation between training load and your resulting fitness.
The other graph known as Form (purple) is the difference between the Load and Fitness values and is an indication of your readiness to train or absorb adaptations. When your form is in the green zone then you are likely in the optimal zone for fitness gains. If you stray into the red zone for any extended period of time then you are at risk of overtraining. And while not advisable to “chase” numbers, you should aim to keep your form in the green zone for fitness gains and remain above (-20 to 50) when you want to maximize recovery or rest.
You may be asking yourself what reasonable values are for your fitness. The short answer is that it depends! Both on your physiology and the type of training you are doing. For example, a reasonably fit cyclist may maintain a fitness level of 40-60 while a competitive cyclist may be able to maintain a fitness level of 80 or more. Elite or professional cyclists often have fitness levels above 120 during the race season.
A high fitness level is the result of a high training load which is itself a combination of training intensity and volume. If you want to keep your current fitness level then you need to maintain the same training load that helped create it. If you want to increase your fitness level then you need to progressively increase your training load by adding more volume or intensity of your training; all while avoiding trying not to overtrain as the body’s adaptations occur during periods of rest.
Here is a simple rule of thumb for understanding how much weekly load you need to achieve a certain fitness level:
| Weekly Load ✦ | Expected Fitness Level |
|---|---|
| 210 | 30 |
| 280 | 40 |
| 350 | 50 |
| 420 | 60 |
| 490 | 70 |
✦ approximate average Weekly Load over 6 weeks
The true value of the Load and Fitness graphs and numbers is not in their absolute number (which vary by person and circumstances) but in the relative numbers from week to week. Use the change in these values each week to understand how your training plan is affecting your fitness.
It is important to never make a decision to skip a rest week based on the Load or Fitness graphs. During a rest week, your load and fitness values will naturally decrease but your form will increase as will your body’s adaptation response to your previous training stimulus. After your rest week, you can revert to your training plan to consolidate your performance increases on the bike.
To begin with these numbers will feel alien and a little difficult to understand but with time you will begin to appreciate what they mean as you begin to see how the graphs respond to your training. One key observation that you will make is how important it is to maintain consistency in training and how this delivers more impact than random high intensity weeks with week long gaps between them.